Rental Index - We need to compare the trend price VS rent
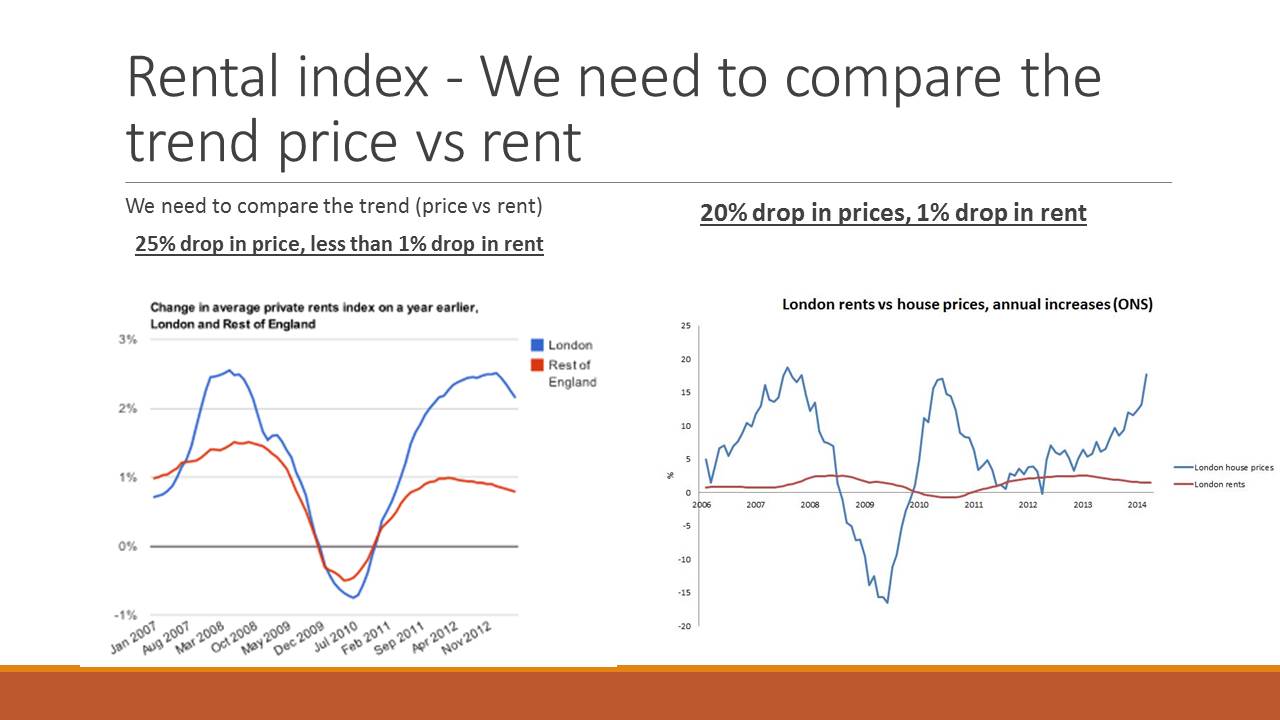
Chart (left)
What we need to know if what would happen when property prices are volatile. We can notice that on the right side of the chart. What happens to rent over 5 years from Jan 2007 - Nov 2012. We can notice that during economic turmoil from 2008 to 2010. Rent only reduced at less than 1% at the lowest point. The volatility outside of London is even less severe. I think the reason being, rents are often set for 1 year and therefore, rents volatility does not reflect as quickly as property prices.
As a investor, that is good news because this shows no matter when you have decided to go into the market, it is unlikely to make a loss because even a 20% price drop, you will experience a 1% drop in rental income. It is highly possible your rent could take this hit ( we will you an example calculation on the next slide)
Chart (right)
This graph tells much story that the one on the left.
1. the first thing that I notice is the sharp dive on house prices during 2008 to 2010.
2. you can see that the rent only started to decrease 2010, rent is reacting to market volatility slower than property price
3. From 2006 - 2008, property price increased about 20% in London, Rent only increased to just less than 5% at its highest. This means that rental return is diminishing.
4. In 2014, London house price is breaking records, an increase of over 20%. However, you can notice that never increases over 5% and it was even going down from 2013 - 2014
As a conclusion, the housing market looks pretty stable to me as an investor.
Let us know in our blog post if you have any comments! I will be waiting for you
 RSS Feed